This uses our standard buildpack, but each module must get a custom .blazar.yaml to pass in required properties to the build. One can distribute that .blazar.yaml using build-scripts/copy_blazar_yaml.sh. In order to minimize the duplication, most of the customizations are consolidated in build-scripts/prepare_environment.sh. The RPM build is hooked into the standard build hbase-assembly, as a post-build step. The RPM build scripts in hbase-assembly/rpm-build handle turning the assembled tar.gz into multiple RPMs. We required some minor changes to the descriptor in hbase-assembly to account for the fact that our build processes each module independently instead of as a single reactor build. As a result, moduleSet does not work, so moduleSet usages were converted to dependencySet. |
||
|---|---|---|
| .. | ||
| img | ||
| src | ||
| .blazar.yaml | ||
| README.md | ||
| pom.xml | ||
README.md
hbtop
Overview
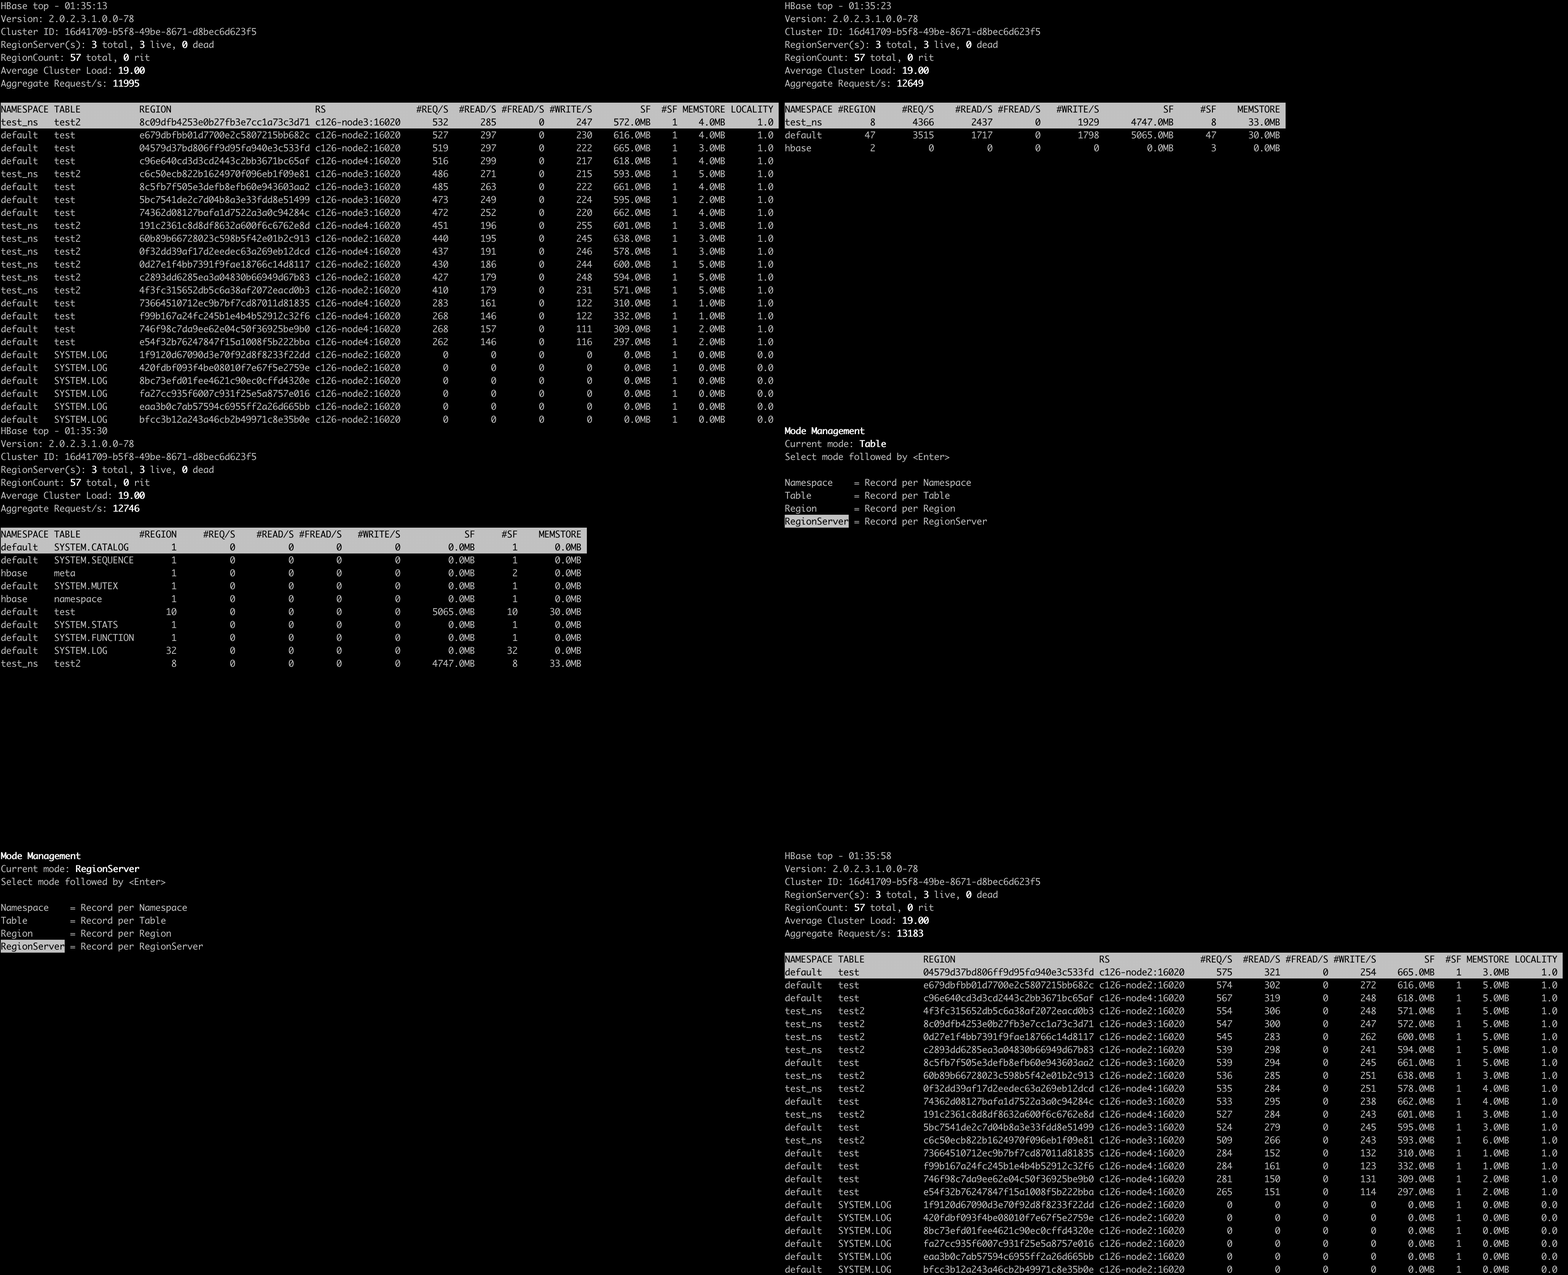
hbtop is a real-time monitoring tool for HBase like Unix's top command.
It can display summary information as well as metrics per Region/Namespace/Table/RegionServer.
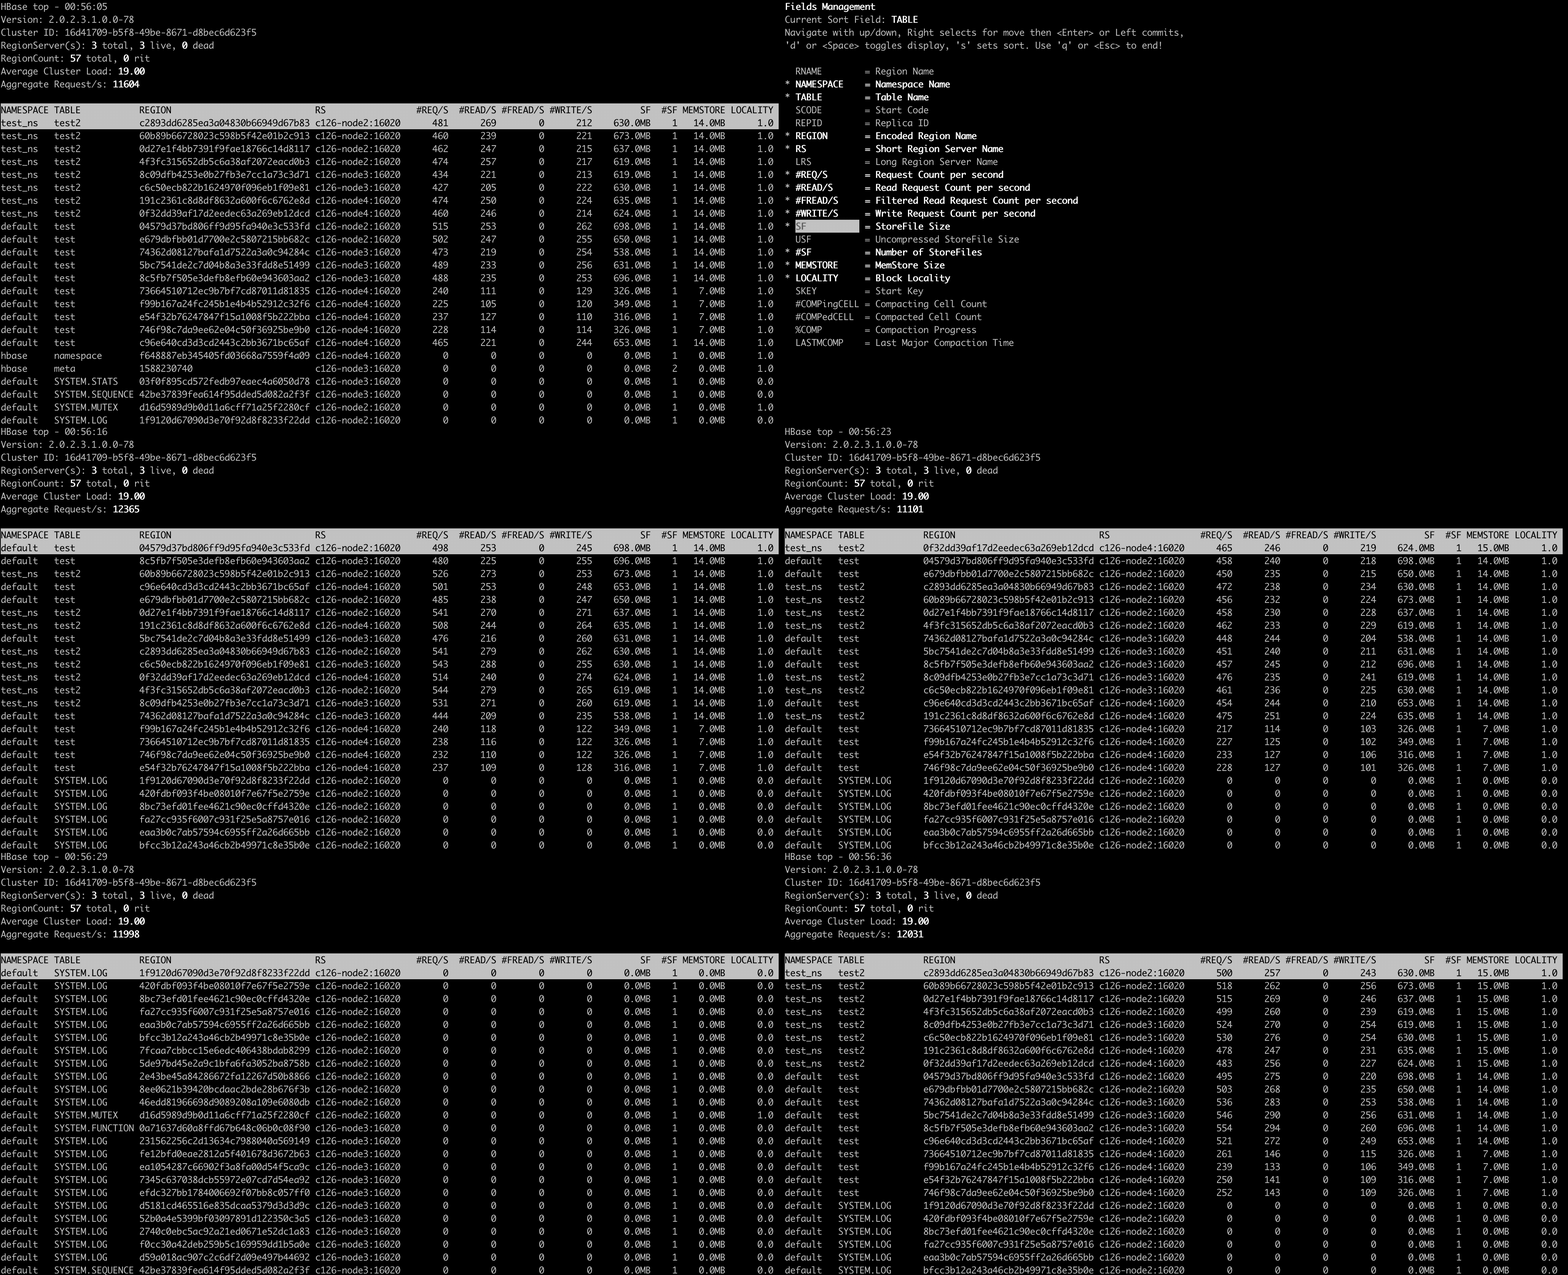
In this tool, you can see the metrics sorted by a selected field and filter the metrics to see only metrics you really want to see.
Also, with the drill-down feature, you can find hot regions easily in a top-down manner.
Usage
You can run hbtop with the following command:
$ hbase hbtop
In this case, the values of hbase.client.zookeeper.quorum and zookeeper.znode.parent in hbase-site.xml in the classpath or the default values of them are used to connect.
Or, you can specify your own zookeeper quorum and znode parent as follows:
$ hbase hbtop -Dhbase.client.zookeeper.quorum=<zookeeper quorum> -Dzookeeper.znode.parent=<znode parent>
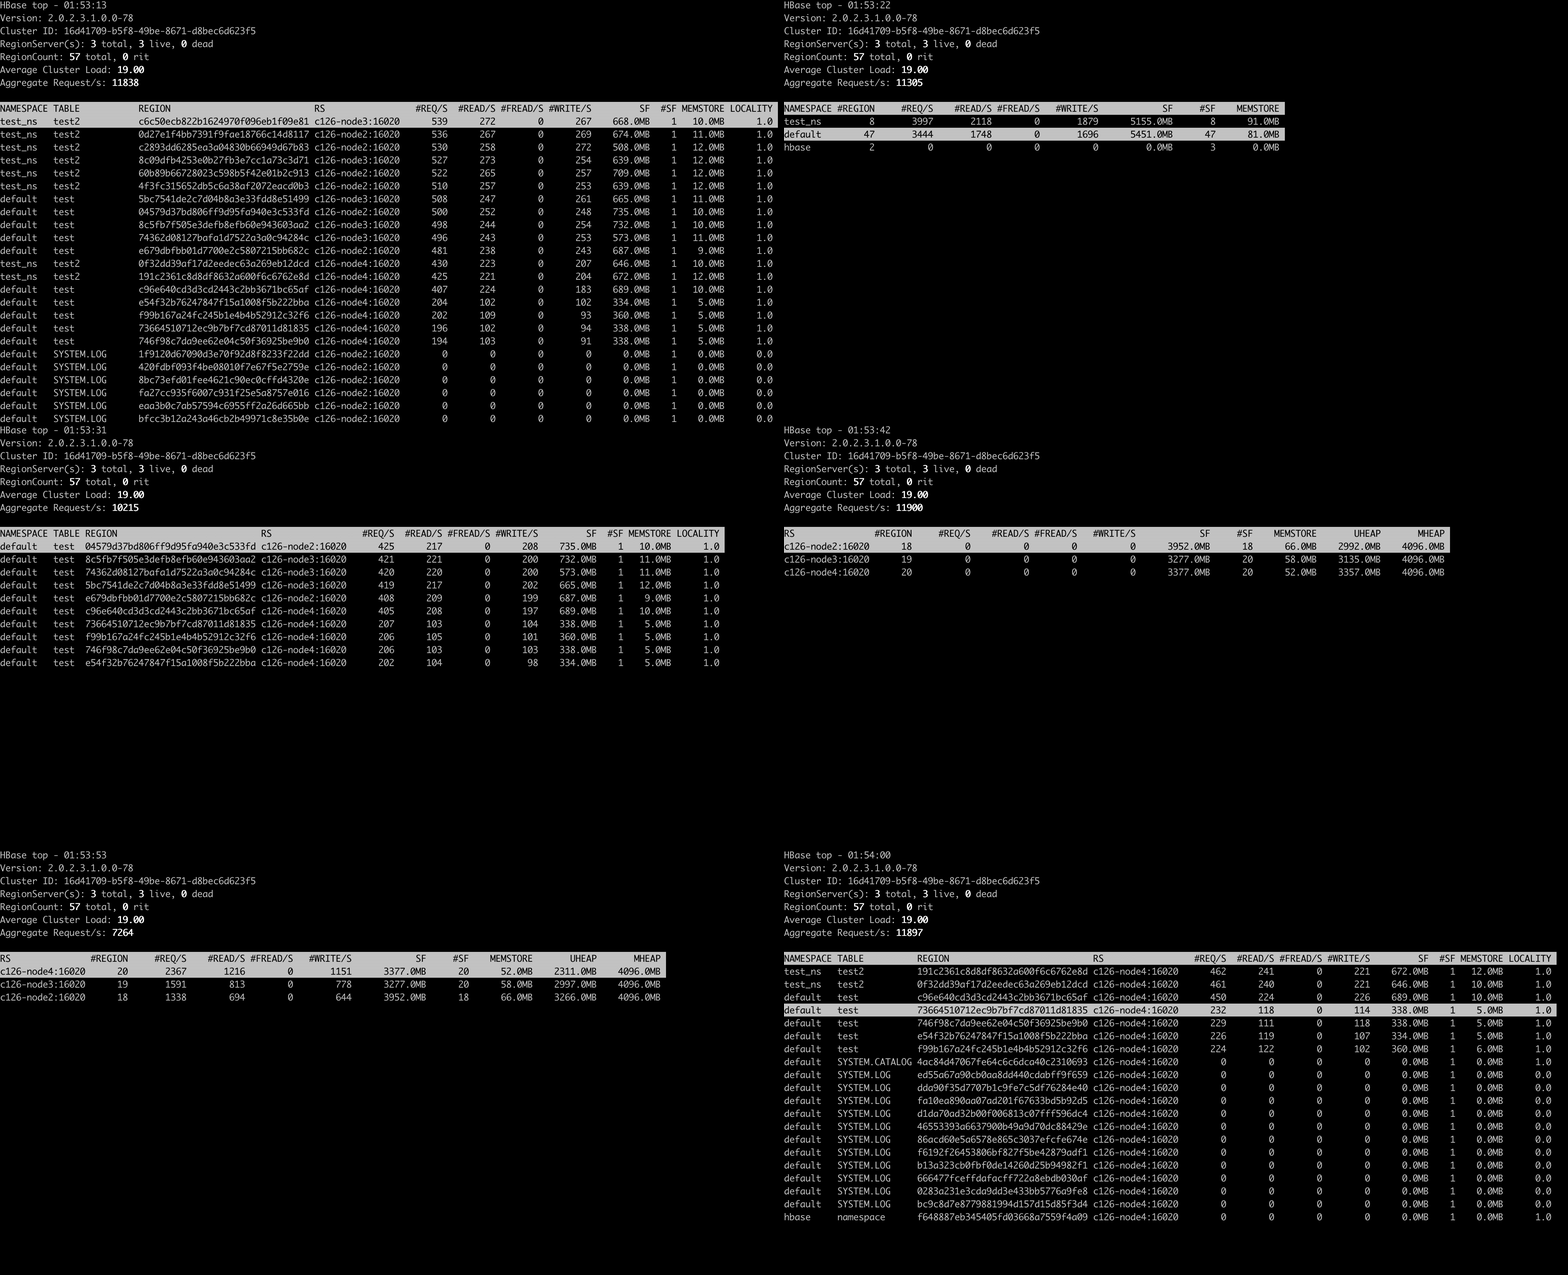
The top screen consists of a summary part and of a metrics part.
In the summary part, you can see HBase Version, Cluster ID, The number of region servers, Region count, Average Cluster Load and Aggregated Request/s.
In the metrics part, you can see metrics per Region/Namespace/Table/RegionServer depending on the selected mode.
The top screen is refreshed in a certain period – 3 seconds by default.
Scrolling metric records
You can scroll the metric records in the metrics part.
Command line arguments
| Argument | Description |
|---|---|
| -d,--delay <arg> | The refresh delay (in seconds); default is 3 seconds |
| -h,--help | Print usage; for help while the tool is running press h key |
| -m,--mode <arg> | The mode; n (Namespace)|t (Table)|r (Region)|s (RegionServer), default is r (Region) |
Modes
There are the following 4 modes in hbtop:
| Mode | Description |
|---|---|
| Region | Showing metric records per region |
| Namespace | Showing metric records per namespace |
| Table | Showing metric records per table |
| RegionServer | Showing metric records per region server |
Region mode
In Region mode, the default sort field is #REQ/S.
The fields in this mode are as follows:
| Field | Description | Displayed by default |
|---|---|---|
| RNAME | Region Name | false |
| NAMESPACE | Namespace Name | true |
| TABLE | Table Name | true |
| SCODE | Start Code | false |
| REPID | Replica ID | false |
| REGION | Encoded Region Name | true |
| RS | Short Region Server Name | true |
| LRS | Long Region Server Name | false |
| #REQ/S | Request Count per second | true |
| #READ/S | Read Request Count per second | true |
| #FREAD/S | Filtered Read Request Count per second | true |
| #WRITE/S | Write Request Count per second | true |
| SF | StoreFile Size | true |
| USF | Uncompressed StoreFile Size | false |
| #SF | Number of StoreFiles | true |
| MEMSTORE | MemStore Size | true |
| LOCALITY | Block Locality | true |
| SKEY | Start Key | false |
| #COMPingCELL | Compacting Cell Count | false |
| #COMPedCELL | Compacted Cell Count | false |
| %COMP | Compaction Progress | false |
| LASTMCOMP | Last Major Compaction Time | false |
Namespace mode
In Namespace mode, the default sort field is #REQ/S.
The fields in this mode are as follows:
| Field | Description | Displayed by default |
|---|---|---|
| NAMESPACE | Namespace Name | true |
| #REGION | Region Count | true |
| #REQ/S | Request Count per second | true |
| #READ/S | Read Request Count per second | true |
| #FREAD/S | Filtered Read Request Count per second | true |
| #WRITE/S | Write Request Count per second | true |
| SF | StoreFile Size | true |
| USF | Uncompressed StoreFile Size | false |
| #SF | Number of StoreFiles | true |
| MEMSTORE | MemStore Size | true |
Table mode
In Table mode, the default sort field is #REQ/S.
The fields in this mode are as follows:
| Field | Description | Displayed by default |
|---|---|---|
| NAMESPACE | Namespace Name | true |
| TABLE | Table Name | true |
| #REGION | Region Count | true |
| #REQ/S | Request Count per second | true |
| #READ/S | Read Request Count per second | true |
| #FREAD/S | Filtered Read Request Count per second | true |
| #WRITE/S | Write Request Count per second | true |
| SF | StoreFile Size | true |
| USF | Uncompressed StoreFile Size | false |
| #SF | Number of StoreFiles | true |
| MEMSTORE | MemStore Size | true |
RegionServer mode
In RegionServer mode, the default sort field is #REQ/S.
The fields in this mode are as follows:
| Field | Description | Displayed by default |
|---|---|---|
| RS | Short Region Server Name | true |
| LRS | Long Region Server Name | false |
| #REGION | Region Count | true |
| #REQ/S | Request Count per second | true |
| #READ/S | Read Request Count per second | true |
| #FREAD/S | Filtered Read Request Count per second | true |
| #WRITE/S | Write Request Count per second | true |
| SF | StoreFile Size | true |
| USF | Uncompressed StoreFile Size | false |
| #SF | Number of StoreFiles | true |
| MEMSTORE | MemStore Size | true |
| UHEAP | Used Heap Size | true |
| MHEAP | Max Heap Size | true |
Changing mode
You can change mode by pressing m key in the top screen.
Changing the refresh delay
You can change the refresh by pressing d key in the top screen.
Changing the displayed fields
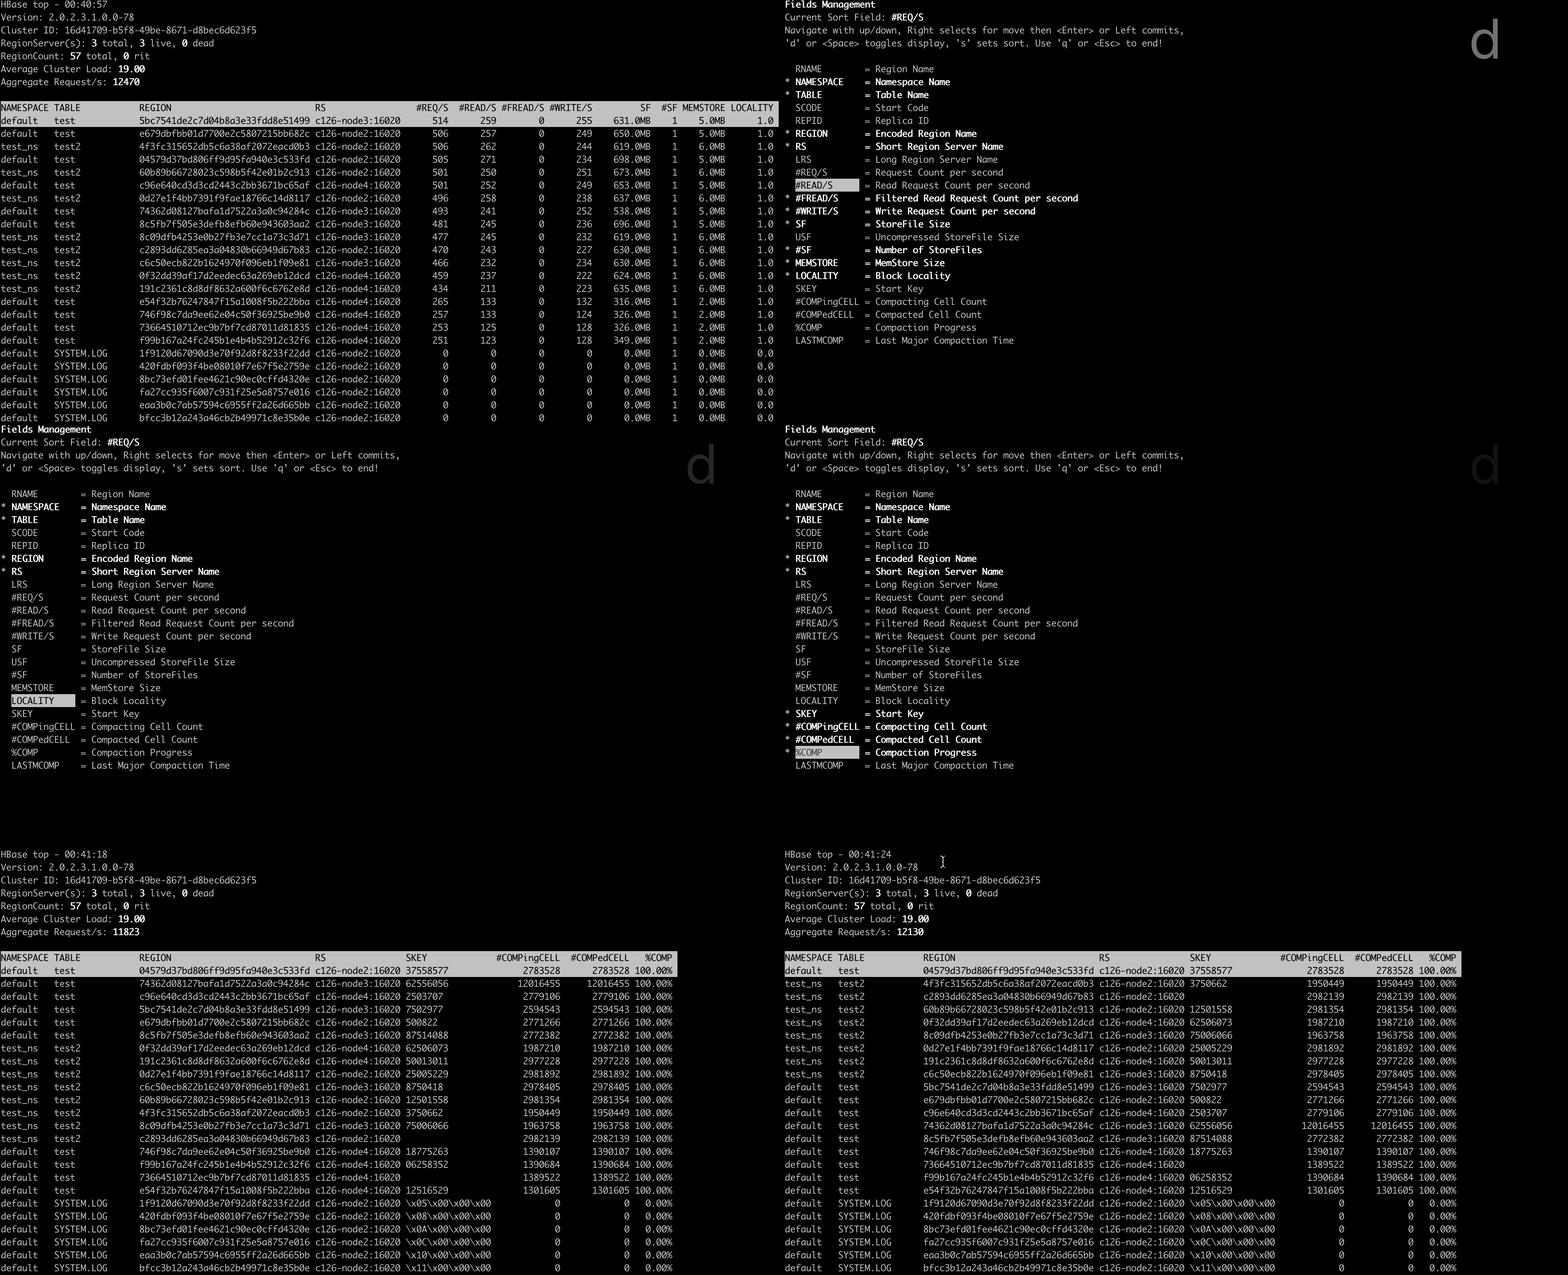
You can move to the field screen by pressing f key in the top screen. In the fields screen, you can change the displayed fields by choosing a field and pressing d key or space key.
Changing the sort field
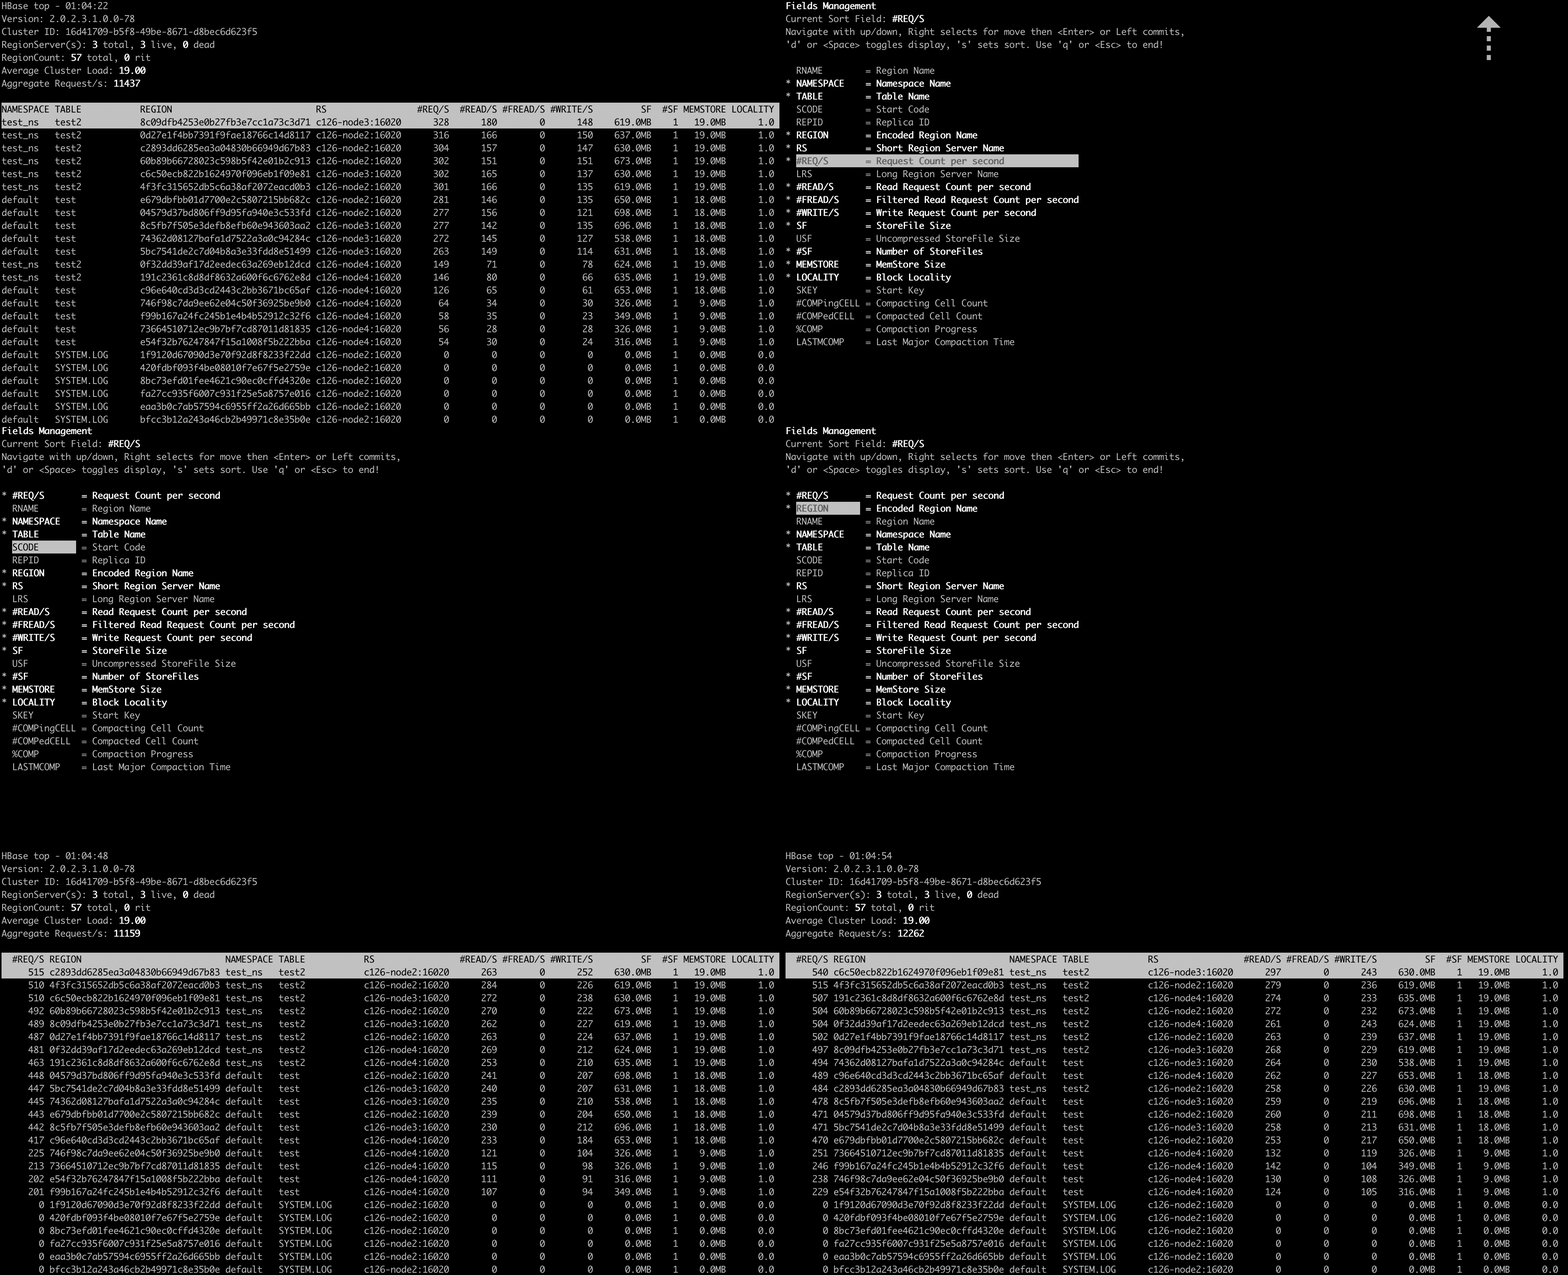
You can move to the fields screen by pressing f key in the top screen. In the field screen, you can change the sort field by choosing a field and pressing s. Also, you can change the sort order (ascending or descending) by pressing R key.
Changing the order of the fields
You can move to the fields screen by pressing f key in the top screen. In the field screen, you can change the order of the fields.
Filters
You can filter the metric records with the filter feature. We can add filters by pressing o key for ignoring case or O key for case sensitive.
The syntax is as follows:
<Field><Operator><Value>
For example, we can add filters like the following:
NAMESPACE==default
REQ/S>1000
The operators we can specify are as follows:
| Operator | Description |
|---|---|
| = | Partial match |
| == | Exact match |
| > | Greater than |
| >= | Greater than or equal to |
| < | Less than |
| <= | Less than and equal to |
You can see the current filters by pressing ^o key and clear them by pressing = key.
Drilling down
You can drill down the metric record by choosing a metric record that you want to drill down and pressing i key in the top screen. With this feature, you can find hot regions easily in a top-down manner.
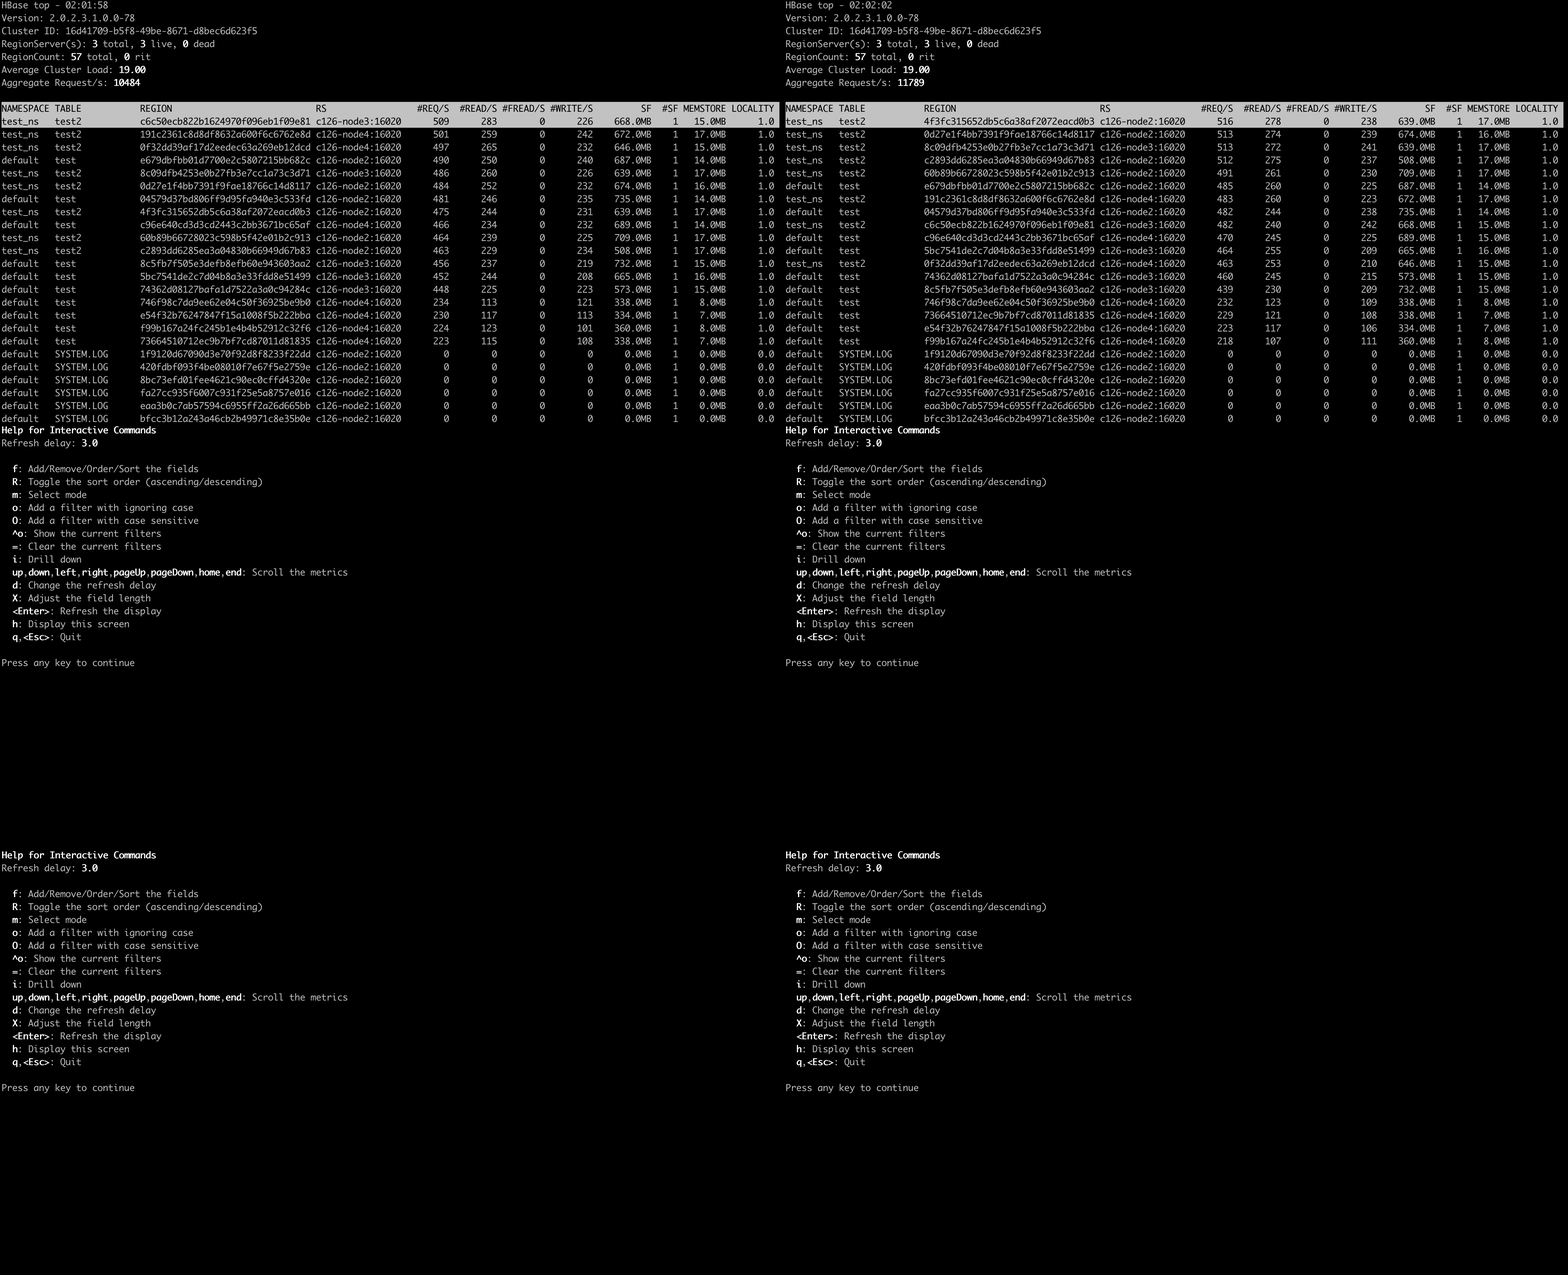
Help screen
You can see the help screen by pressing h key in the top screen.
Others
How hbtop gets the metrics data
hbtop gets the metrics from ClusterMetrics which is returned as the result of a call to Admin#getClusterMetrics() on the current HMaster. To add metrics to hbtop, they will need to be exposed via ClusterMetrics.


