Commit Graph

67 Commits

Author SHA1 Message Date
Bianca Nenciu 0a27086764
FEATURE: Export all types of reports (#8748)
There is a single stacked_chart which was not exportable
2020-01-21 18:43:19 +02:00
Robin Ward f03edb36be REFACTOR: Remove `Discourse.Model` 2019-11-08 14:13:35 -05:00
Mark VanLandingham 6275c05c0d
DEV: Move computed to discourseComputed (#8312) 2019-11-07 15:38:28 -06:00
Robin Ward dceb72bc69 FIX: Move `makeArray` to discourse-common 2019-11-01 13:50:15 -04:00
Robin Ward 89f602f66b REFACTOR: `Ember.makeArray` was removed from the public API 2019-11-01 13:50:15 -04:00
Robin Ward 90f934a660 REFACTOR: Use a module for `Ember.isEmpty` 2019-11-01 13:50:15 -04:00
Mark VanLandingham c7475ee03b
DEV: Import EmberObject rather than global variable (#8256)
* DEV: Import ember/object rather than Ember.Object globally

* fixed broken object proxy import

* prettier on js

* added @ember/object/proxy to loader

* added unstaged file

* Fixed objet proxy reference is loader

* Linting!
2019-10-29 14:23:50 -05:00
Jarek Radosz 1dcdcb5c31
FIX: Cast all numerical values in reports (#8087)
* FIX: Cast all numerical values in reports

The backend can return some numerical values in report as strings. That results in unexpected order of values when sorting report tables.

* Create `toNumber()` helper

The `typeof` and `parseFloat` seem to be the fastest path: https://jsperf.com/number-vs-typeof-vs-parsefloat#results
2019-09-12 15:17:34 +02:00
Bianca Nenciu b2eb0f4ad6 FEATURE: Export any type of report supporting table mode. (#7662) 2019-06-28 08:50:31 +02:00
Joffrey JAFFEUX c63268467e
DEV: prettier 1.18.2 (#7810) 2019-06-26 17:09:52 +02:00
Joffrey JAFFEUX bfea922167
DEV: global s/this.get\("(\w+)"\)/this.$1 (#7592) 2019-05-27 10:15:39 +02:00
Joffrey JAFFEUX bcca2b5d73
FEATURE: initial implementation of generic filters for reports 2019-04-26 12:17:10 +02:00
Maja Komel 4b455e741e DEV: Ember 3.8.0
Co-Authored-By: majakomel <maja.komel@gmail.com>
2019-04-26 12:16:21 +02:00
Tarek Khalil f8480ed911
FEATURE: Exposing a way to add a generic report filter (#6816)
* FEATURE: Exposing a way to add a generic report filter

## Why do we need this change?

Part of the work discussed [here](https://meta.discourse.org/t/gain-understanding-of-file-uploads-usage/104994), and implemented a first spike [here](https://github.com/discourse/discourse/pull/6809), I am trying to expose a single generic filter selector per report.

## How does this work?

We basically expose a simple, single generic filter that is computed and displayed based on backend values passed into the report.

This would be a simple contract between the frontend and the backend.

**Backend changes:** we simply need to return a list of dropdown / select options, and enable the report's newly introduced `custom_filtering` property.

For example, for our [Top Uploads](https://github.com/discourse/discourse/pull/6809/files#diff-3f97cbb8726f3310e0b0c386dbe89e22R1423) report, it can look like this on the backend:

```ruby
report.custom_filtering = true
report.custom_filter_options = [{ id: "any", name: "Any" }, { id: "jpg", name: "JPEG" } ]
```

In our javascript report HTTP call, it will look like:

```js
{
  "custom_filtering": true,
  "custom_filter_options": [
    {
      "id": "any",
      "name": "Any"
    },
    {
      "id": "jpg",
      "name": "JPG"
    }
  ]
}
```

**Frontend changes:** We introduced a generic `filter` param and a `combo-box` which hooks up into the existing framework for fetching a report.

This works alright, with the limitation of being a single custom filter per report. If we wanted to add, for an instance a `filesize filter`, this will not work for us. _I went through with this approach because it is hard to predict and build abstractions for requirements or problems we don't have yet, or might not have._

## How does it look like?
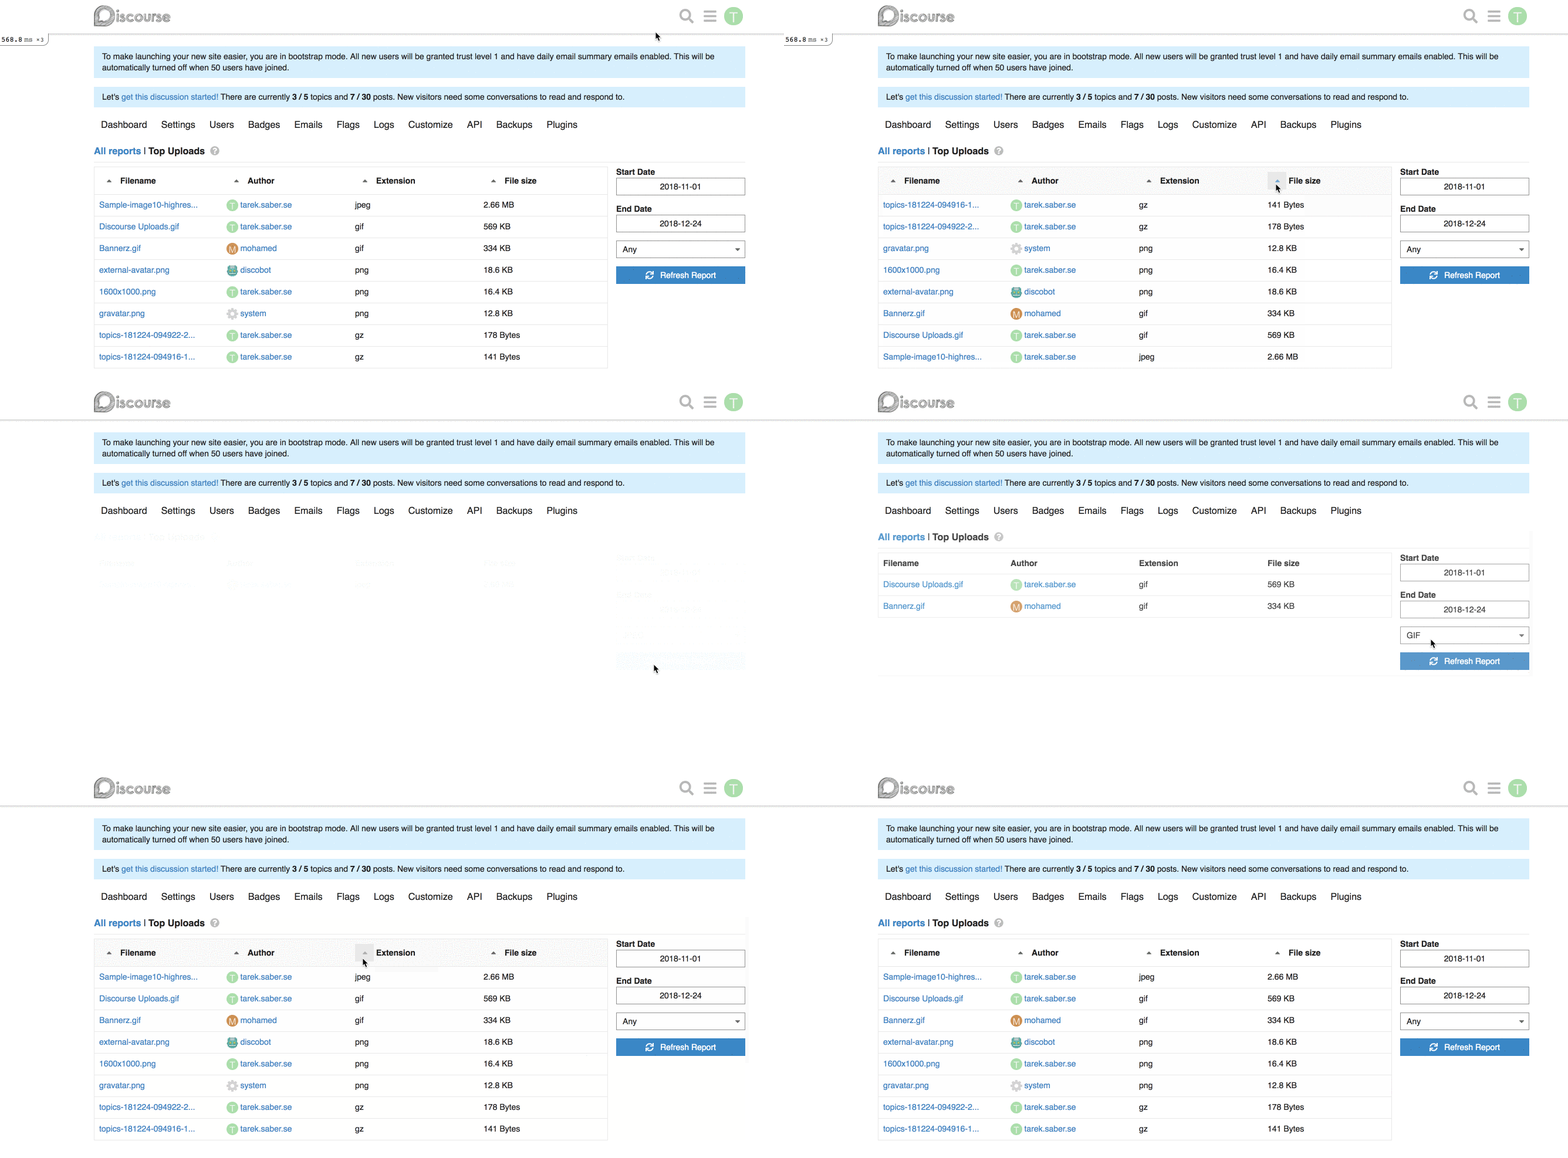
![a1ktg1odde](https://user-images.githubusercontent.com/45508821/50485875-f17edb80-09ee-11e9-92dd-1454ab041fbb.gif)

## More on the bigger picture

The major concern here I have is the solution I introduced might serve the `think small` version of the reporting work, but I don't think it serves the `think big`, I will try to shed some light into why.

Within the current design, It is hard to maintain QueryParams for dynamically generated params (based on the idea of introducing more than one custom filter per report).

To allow ourselves to have more than one generic filter, we will need to:

a. Use the Route's model to retrieve the report's payload (we are now dependent on changes of the QueryParams via computed properties)
b. After retrieving the payload, we can use the `setupController` to define our dynamic QueryParams based on the custom filters definitions we received from the backend
c. Load a custom filter specific Ember component based on the definitions we received from the backend
2019-03-15 12:15:38 +00:00
David Taylor eb617dea4b DEV: Run prettier on `report.js.es6`
The prettier version I was running was different to the CI pipeline
2019-02-01 13:22:31 +00:00
David Taylor 5c9426be48 SECURITY: Escape HTML in dashboard report tables 2019-02-01 13:10:59 +00:00
Joffrey JAFFEUX 3e1e9fce7e
FIX: better legend labels for stacked-charts (#6914) 2019-01-21 17:10:10 +01:00
Joffrey JAFFEUX b95165b838
FEATURE: adds a new chart report to track pageviews (#6913) 2019-01-21 15:17:04 +01:00
Joffrey JAFFEUX 7908a522a0
FIX: postLabel was not working for totals (#6904) 2019-01-18 17:06:43 +01:00
Joffrey JAFFEUX f1269fa807
FEATURE: Add `Top Uploads` report (#6825)
Co-Authored-By: I am very Pro-Grammer. <khalilovcmded@users.noreply.github.com>
2018-12-28 20:48:54 +01:00
Joffrey JAFFEUX 03014b0d05
FEATURE: adds security tab to dashboard (#6768)
This commit also includes the new staff_logins report
2018-12-14 13:47:59 +01:00
Joffrey JAFFEUX 9672c92045
DEV: removes _.each from codebase (#6629) 2018-11-20 14:46:58 +01:00
Joffrey JAFFEUX 86dafc1f25
DEV: removes _.reduce from codebase (#6628) 2018-11-19 13:04:57 +01:00
Joffrey JAFFEUX 398f98c568
FIX: ensures reports links are correct on subfolder installs 2018-10-26 12:32:02 +02:00
Joffrey JAFFEUX bb93179609
FEATURE: charts will now use tertiary color (#6342) 2018-08-30 14:56:11 +02:00
Joffrey JAFFEUX c08dea386b
FIX: better handling of no prev30Days (#6301) 2018-08-22 18:00:11 +02:00
Joffrey JAFFEUX 37d4f27c44
FIX: quality/bugfix dashboard/reports pass (#6283) 2018-08-17 16:19:25 +02:00
Joffrey JAFFEUX 1ca999fdb5
FIX: formats topic report only if we have one (#6231) 2018-08-02 08:01:17 -04:00
Joffrey JAFFEUX 9073e11943
FIX: improves number/percent support in reports 2018-08-01 18:40:59 -04:00
Joffrey JAFFEUX 2b2a506a7b
FIX: makes dashboard more resilient to errors (#6217)
This commit is an attempt to limit cases where the dashboard will generate a full exception page and also make it easier to track the error.
2018-07-31 21:23:28 -04:00
Joffrey JAFFEUX 0715aa18da
UI: uses tiny avatars for reports (#6215) 2018-07-31 18:57:00 -04:00
Joffrey JAFFEUX 37252c1a5e
UI: improves dashboard table reports
- support for avatars
- support for topic/post/user type in reports
- improved totals row UI
- minor css tweaks
2018-07-31 17:35:13 -04:00
Joffrey JAFFEUX 3fdc4f2df1
FIX: do not automatically infere date type (#6127) 2018-07-20 09:35:14 -04:00
Joffrey JAFFEUX 1a78e12f4e
FEATURE: part 2 of dashboard improvements
- moderation tab
- sorting/pagination
- improved third party reports support
- trending charts
- better perf
- many fixes
- refactoring
- new reports

Co-Authored-By: Simon Cossar <scossar@users.noreply.github.com>
2018-07-19 14:33:11 -04:00
Joffrey JAFFEUX 03a7d532cf
DEV: introduces prettier for es6 files 2018-06-15 17:03:24 +02:00
Joffrey JAFFEUX 16d0ab5654 Revert "UX: localizes titles in dashboard table reports"
This reverts commit 409c0ddf85.
2018-05-28 20:35:22 +02:00
Joffrey JAFFEUX 409c0ddf85
UX: localizes titles in dashboard table reports 2018-05-28 20:03:05 +02:00
Joffrey JAFFEUX 82e5727287
UX: -2/+2% change in stats should be no-change in dashboard 2018-05-28 10:55:42 +02:00
Joffrey JAFFEUX acc5e42066
removes logging 2018-05-25 12:12:28 +02:00
Joffrey JAFFEUX e67ac93e6c
UX: makes table report trend icons as charts
This commit will also reverse icon orientation if higher_is_better = false
2018-05-25 12:09:30 +02:00
Joffrey JAFFEUX 4fd17abb76
linting 2018-05-17 23:44:38 +02:00
Kris c1f13ce6a6 adding icons, updating style 2018-05-17 17:03:56 -04:00
Joffrey JAFFEUX af548c23c4
new dashboard quality pass (code, tests and UI) 2018-05-17 22:44:33 +02:00
Sam c381d60471 Replace the "posts" line with message count 2018-05-17 10:26:30 +10:00
Joffrey JAFFEUX 9947c38e1c
UX: support for multiple datasets in one chart 2018-05-15 20:12:03 +02:00
Sam eb33f6e9b9 correct daily engaged users to look at average 2018-05-15 10:17:17 +10:00
Sam cb9baaade9 correct localization for dashboard periods
previously would fail for non roman numerals
2018-05-14 16:31:50 +10:00
Sam 5f54b005a1 UX: remove ? from new dashboard
Link to actual report
2018-05-14 11:33:36 +10:00
Sam 9d97e1244e correct it so when we have no dates we still return graphs 2018-05-14 11:12:52 +10:00
Sam e92f9568a4 correct typo 2018-05-11 16:25:41 +10:00