44 lines
3.1 KiB
Markdown
44 lines
3.1 KiB
Markdown
|
|
---
|
||
|
|
layout: default
|
||
|
|
title: Integrating plugins into a dashboard
|
||
|
|
parent: Observability
|
||
|
|
nav_order: 5
|
||
|
|
---
|
||
|
|
|
||
|
|
# Integrating plugins into a dashboard
|
||
|
|
|
||
|
|
Observability is a collection of plugins and applications that let you visualize data-driven events by using [Piped Processing Language]({{site.url}}{{site.baseurl}}/search-plugins/sql/ppl/index/) to explore, discover, and query data stored in OpenSearch. Observability provides a unified experience for collecting and monitoring metrics, logs, and traces from common data sources. With data collection and monitoring in one place, you have full-stack, end-to-end observability of your entire infrastructure.
|
||
|
|
|
||
|
|
As of OpenSearch 2.7, you can manage your observability plugins with **Observability Dashboards** or **Dashboard** instead of the plugins page. This feature provides you:
|
||
|
|
|
||
|
|
- **Instant access to installed plugins:** The dashboard displays all installed plugins in one place.
|
||
|
|
- **Improved efficiency:** With a list of plugins readily available from a dashboard, you can enable, disable, update, or remove plugins in the OpenSearch Dashboards UI.
|
||
|
|
- **Better troubleshooting:** Viewing a list of plugins from a dashboard can help you quickly identify which plugins may be causing a problem.
|
||
|
|
- **Enhanced security:** With a list of plugins readily available from a dashboard, you can easily see if any outdated or vulnerable plugins are present and then quickly remove or update them, minimizing or avoiding security risks.
|
||
|
|
- **Improved website performance:** Viewing a list of plugins from a dashboard can help you identify any plugins that may be slowing down your website or causing performance issues.
|
||
|
|
|
||
|
|
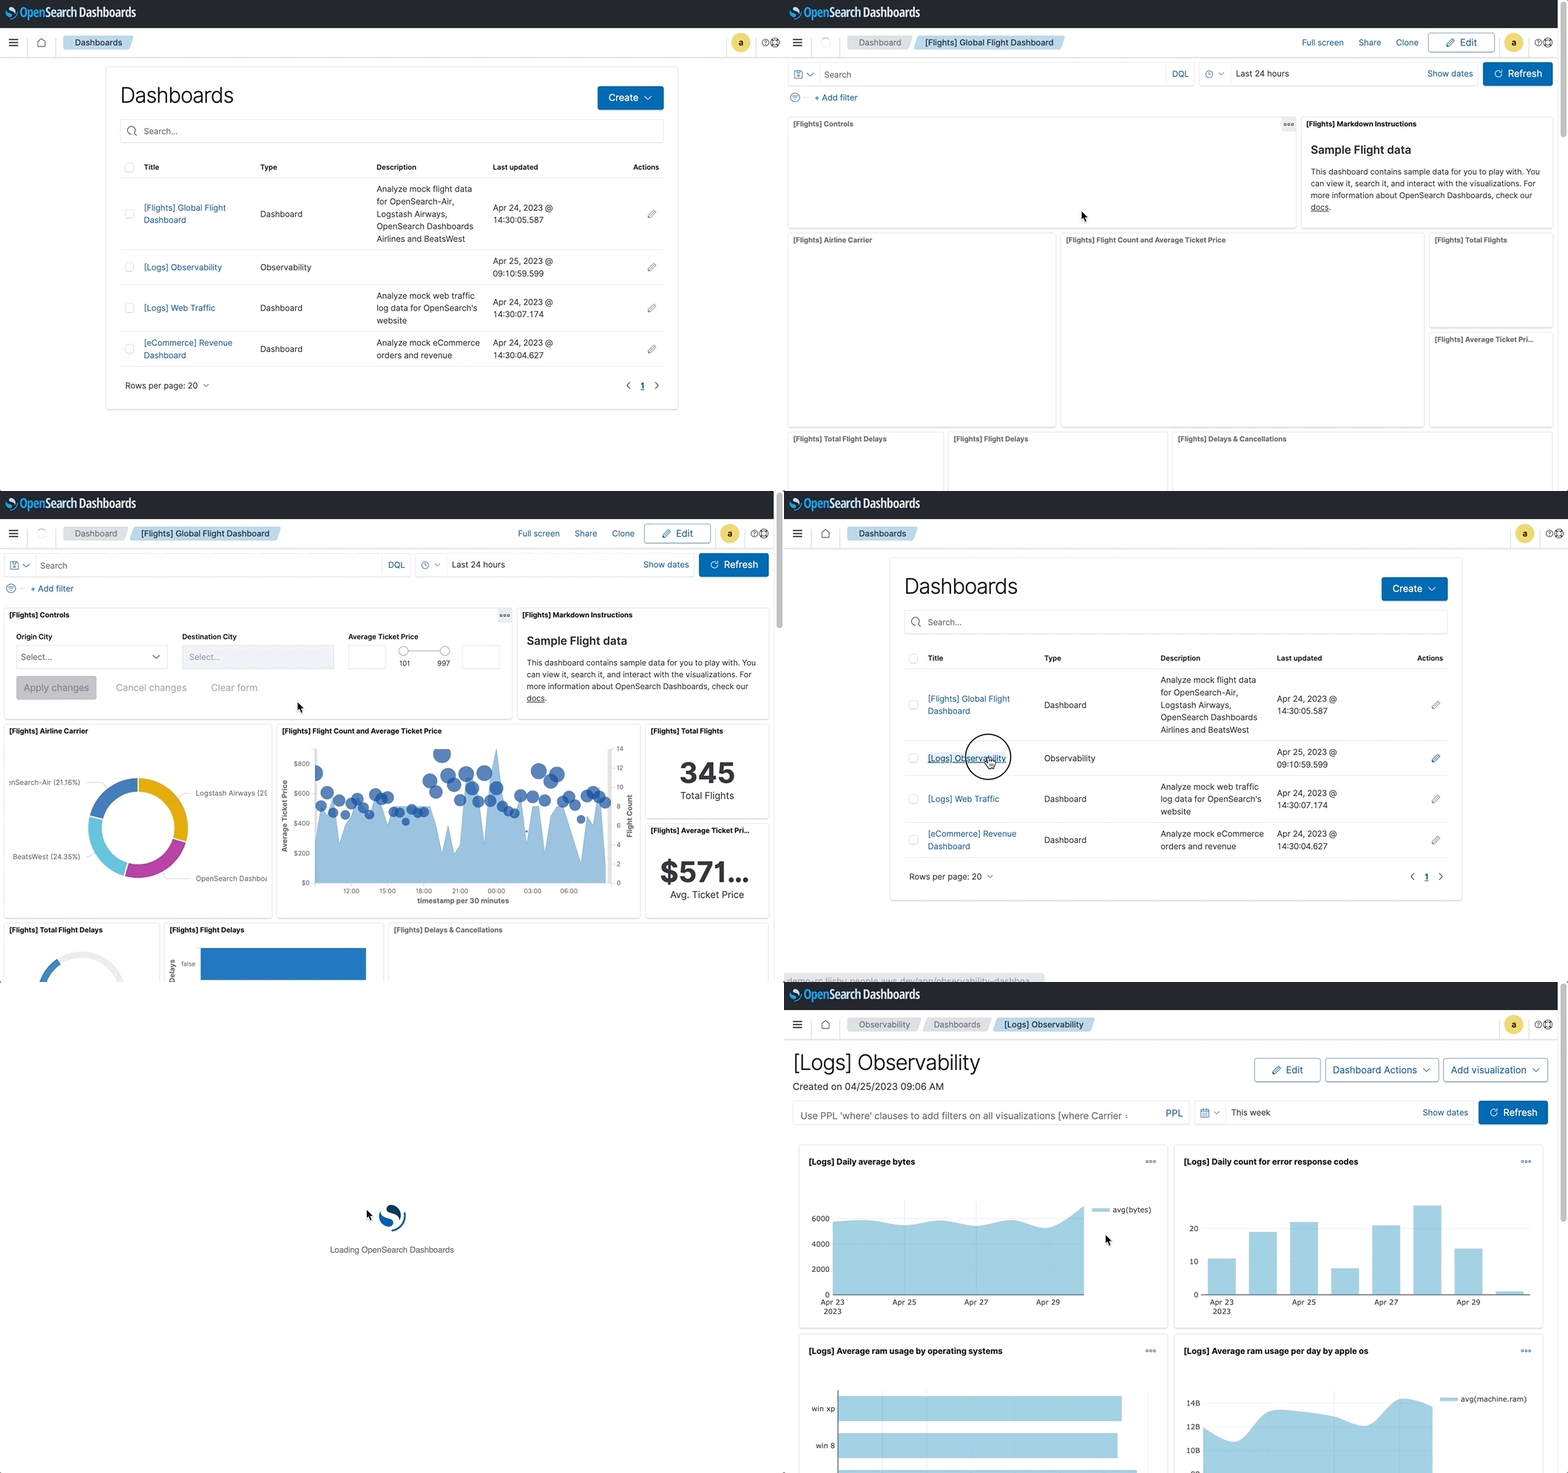
Get familiar with the basics of managing plugins from the Dashboard app in less than 20 seconds in the following video.
|
||
|
|
|
||
|
|

|
||
|
|
|
||
|
|
## Viewing a list of installed plugins
|
||
|
|
|
||
|
|
To view a list of installed plugins from the Dashboard app, follow these steps:
|
||
|
|
|
||
|
|
1. From the OpenSearch Dashboards main menu, select **Dashboard**.
|
||
|
|
2. View the list of items and select your plugin. Plugins are categorized automatically as the Observability Dashboard data type, which you can filter in order to concentrate on just what you want to see.
|
||
|
|
|
||
|
|
## Adding and removing plugins
|
||
|
|
|
||
|
|
To add a plugin from the Dashboard app, follow these steps:
|
||
|
|
|
||
|
|
1. From the OpenSearch Dashboards main menu, select **Dashboard**.
|
||
|
|
2. In the **Dashboards** window, select **Create** > **Dashboard**.
|
||
|
|
3. In the **Create operational panel** window, enter a name in the **Name** field and then select **Create**. The plugin is added to both the Observability app and the Dashboard app.
|
||
|
|
|
||
|
|
You can remove a plugin from the Dashboard app by selecting the edit icon under the **Actions** column and then selecting **Delete**.
|
||
|
|
|
||
|
|
## Staying updated about OpenSearch Dashboards plugins
|
||
|
|
|
||
|
|
The [OpenSearch plugins repository](https://github.com/opensearch-project/opensearch-plugins) on GitHub is a great way to keep track of and contribute to tasks, features, enhancements, and bugs. The OpenSearch Project team welcomes your input.
|