3.8 KiB
Management Console
Apache ActiveMQ Artemis ships by default with a management console. It is powered by Hawt.io.
Its purpose is to expose the Management API via a user friendly web ui.
Login
To access the management console use a browser and go to the URL http://localhost:8161/console.
A login screen will be presented, if your broker is secure, you will need to use a user with admin role, if it is unsecure simply enter any user/password.
Security
That Jolokia JMX-HTTP bridge is secured via a policy file in the broker configuration directory: 'etc/jolokia-access.xml'. The contents of that file should be modified as described in the Jolokia Security Guide. By default the console is locked down to 'localhost', pay particular attention to the 'CORS' restrictions when exposing the console web endpoint over the network.
Console
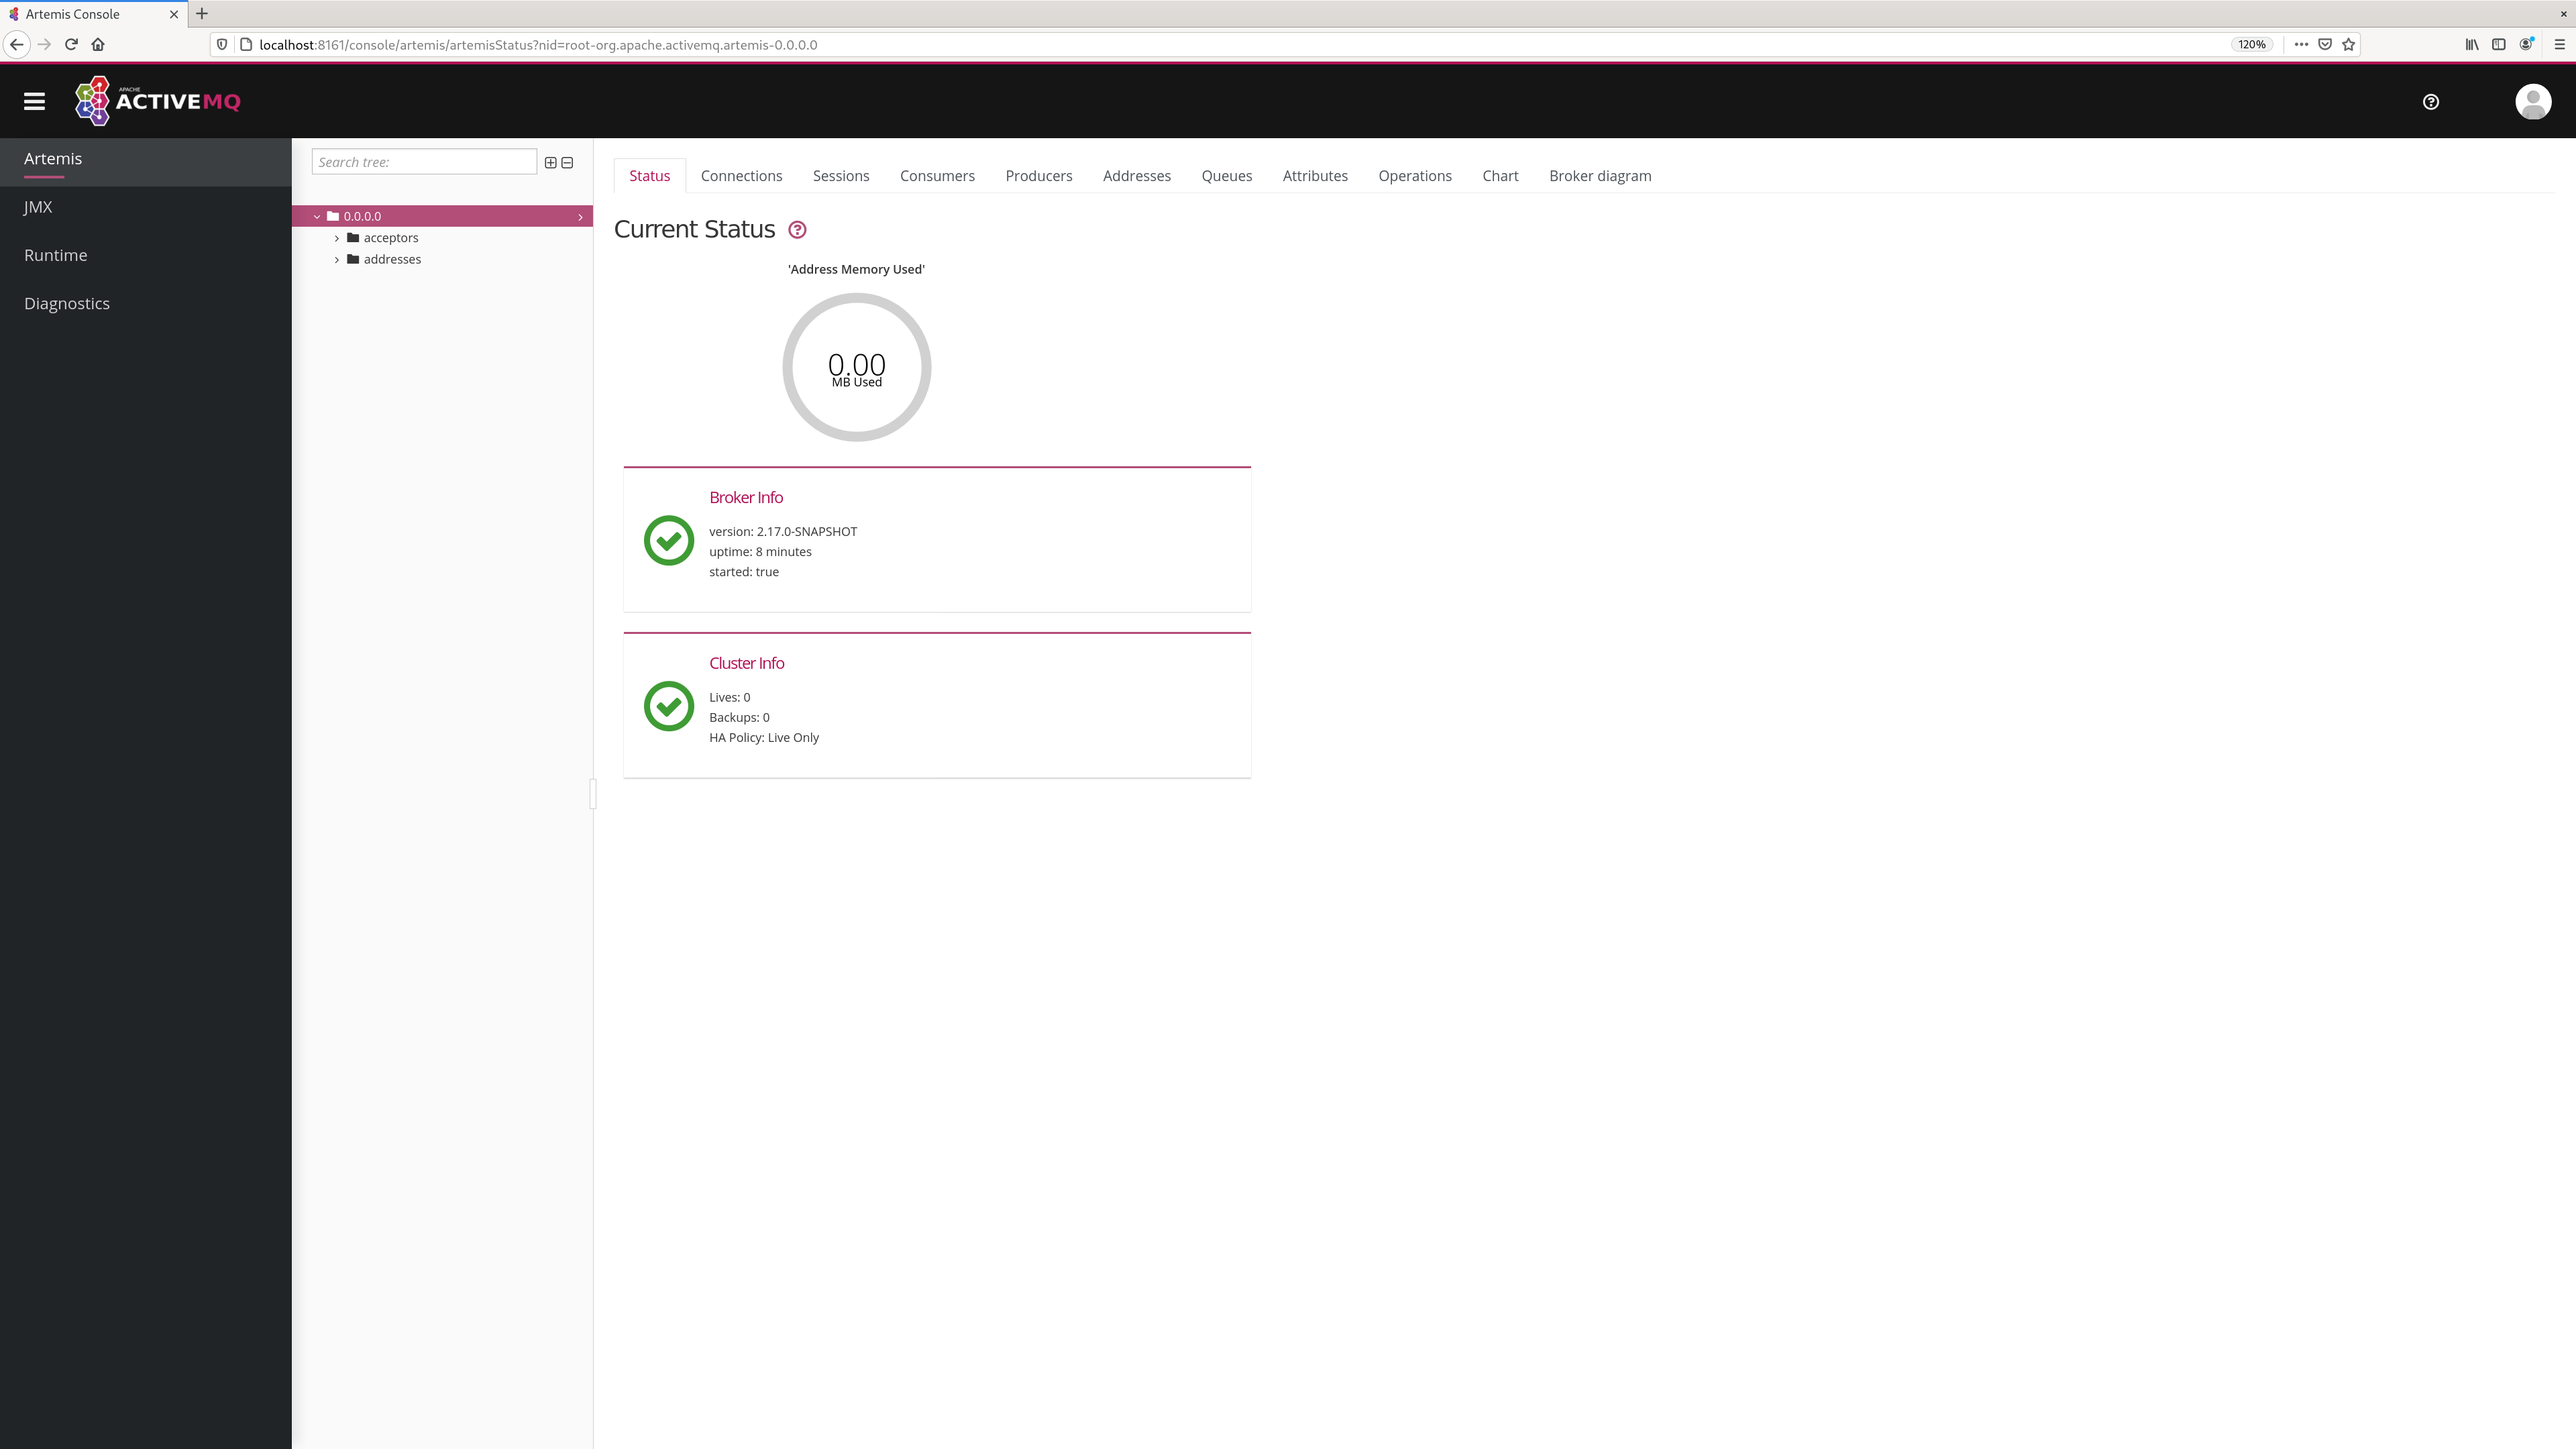
Once logged in you should be presented with a screen similar to.
Navigation Menu
On the top right is small menu area you will see some icons.
question markThis will open a menu with the following itemsHelpThis will navigate to the console user guideAboutthis will load an about screen, here you will be able to see and validate versions
personwill provide a drop down menu withPreferencesthis will open the preferences pageLog outself descriptive.
Navigation Tabs
Running below the Navigation Menu you will see several default feature tabs.
-
ArtemisThis is the core tab for Apache ActiveMQ Artemis specific functionality. The rest of this document will focus on this. -
ConnectThis allows you to connect to a remote broker from the same console. -
DashboardHere you can create and save graphs and tables of metrics available via JMX, a default jvm health dashboard is provided. -
JMXThis exposes the raw Jolokia JMX so you can browse/access all the JMX endpoints exposed by the JVM. -
ThreadsThis allows you to monitor the thread usage and their state.
You can install further hawtio plugins if you wish to have further functionality.
Artemis Tab
Click Artemis in the left navigation bar to see the Artemis specific plugin. (The Artemis tab won't appear if there is no broker in this JVM). The Artemis plugin works very much the same as the JMX plugin however with a focus on interacting with an Artemis broker.
Tree View
The tree view on the left-hand side shows the top level JMX tree of each broker instance running in the JVM. Expanding the tree will show the various MBeans registered by Artemis that you can inspect via the Attributes tab.
Acceptors
This expands to show and expose details of the current configured acceptors.
Addresses
This expands to show the current configured available addresses.
Under the address you can expand to find the queues for the address exposing attributes
Key Operations
Creating a new Address
To create a new address simply click on the broker or the address folder in the jmx tree and click on the create tab.
Once you have created an address you should be able to Send to it by clicking on it in the jmx tree and clicking on the send tab.
Creating a new Queue
To create a new queue click on the address you want to bind the queue to and click on the create tab.
Once you have created a queue you should be able to Send a message to it or Browse it or view the Attributes or Charts. Simply click on the queue in th ejmx tree and click on the appropriate tab.
You can also see a graphical view of all brokers, addresses, queues and their consumers using the Diagram tab.

