* Only show the top 40 blog tags

In https://github.com/pulumi/pulumi-hugo/pull/215, I had suggested
that instead of physically deleting tags we didn't want to show, we
compute it algorithmically, by only showing the "Top N" tags. This
commit introduces said functionality.

This has a few advantages:

* Preserves old metadata (the authors added the tags because they
  felt they were meaningful and captured information about the posts).

* Enables us to surface those tags differently in the future (who
  knows, maybe someday we'll want to run a "spinnaker" campaign).

* Notably, also keeps the tag index pages, which Google has indexed.

* Enables us to add a "View More ..." link at the bottom of the
  page if folks want to see the entire list.

* Perhaps most importantly, protects against future bloat. For
  example, since this tag cleanup happened, we have added top-level
  tags for "aliases", "app-runner", "iam", "open-source", and
  "refactoring", each of which has only a single post.

I chose 40 as the N in Top N, because that's how many we show today.
I could see an argument for filtering this based on post count
instead (e.g., only those with >3 posts).

* Add back some tags

Now that we filter out unpopular tags, we can add back some of the
ones previously removed.
5.6 KiB
title, date, meta_desc, authors, tags, meta_image
| title | date | meta_desc | authors | tags | meta_image | |||||
|---|---|---|---|---|---|---|---|---|---|---|
| Observability with Infrastructure as Code | 2021-02-26 | Andy Davies from Reaktor introduces observability into infrastructure as code with the Pulumi Automation API |
|
|
reaktor.png |
Guest Article: Andy Davies is a Senior Software Developer at Reaktor, a tech company based in Amsterdam, New York, and Finland, writing about using the Pulumi Automation API to add observability to infrastructure provisioning.
When using the Pulumi Automation API to create applications that provisions infrastructure, it is very handy to use observability techniques to ensure the application functions correctly and to find where performance bottlenecks are.
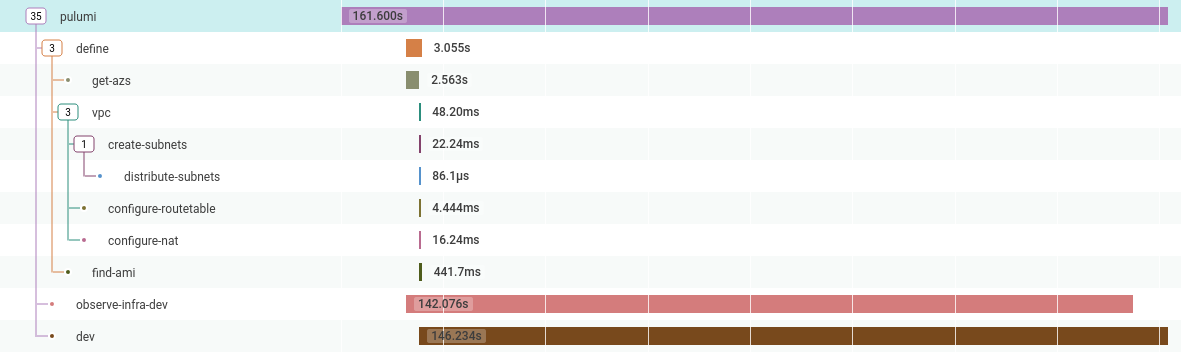
One of the applications I work on creates a VPC and Bastion host and then stores the credentials in a Vault instance. The problem is that the 'create infrastructure' part is an opaque blob, in that I can see it takes 129 seconds to create, but I can’t see what it’s doing or why it takes this amount of time.
So can I do better?
The Initial Application
In this example, I use Honeycomb's Go Beeline to capture all the data I care about; durations, errors, and any context which is 'interesting':
func main() {

	beeline.Init(beeline.Config{
		WriteKey: os.Getenv("HONEYCOMB_API_KEY"),
		Dataset:  "pulumi-demo",
	})
	defer beeline.Close()

	ctx, span := beeline.StartSpan(context.Background(), "basic-vpc")
	defer span.Send()

	name := auto.FullyQualifiedStackName(os.Getenv("PULUMI_USERNAME"), "basic-vpc", "dev")
	stack, err := auto.UpsertStackInlineSource(ctx, name, "basic-vpc", func(pc *pulumi.Context) error {

		azs, err := getAvailabilityZones(ctx)
		if err != nil {
			beeline.AddField(ctx, "err", err)
			return err
		}

		v, err := vpc.NewVpc(ctx, pc, "dev", &vpc.VpcArgs{
			Description:           "dev",
			BaseCidr:              "192.168.0.0/16",
			AvailabilityZoneNames: azs,
			S3Endpoint:            true,
			DynamoEndpoint:        true,
		})
		if err != nil {
			beeline.AddField(ctx, "err", err)
			return err
		}
	})

	if err != nil {
		beeline.AddField(ctx, "err", err)
		os.Exit(1)
	}

	if err := stack.SetConfig(ctx, "aws:region", auto.ConfigValue{Value: os.Getenv("PULUMI_REGION")}); err != nil {
		beeline.AddField(ctx, "err", err)
		os.Exit(1)
	}

	ws := stack.Workspace()
	if err := ws.InstallPlugin(ctx, "aws", "v3.23.0"); err != nil {
		beeline.AddField(ctx, "err", err)
		os.Exit(1)
	}

	if _, err := stack.Refresh(ctx); err != nil {
		beeline.AddField(ctx, "err", err)
		os.Exit(1)
	}

	stream := optup.ProgressStreams(os.Stdout)
	if _, err := stack.Up(ctx, stream); err != nil {
		beeline.AddField(ctx, "err", err)
		os.Exit(1)
	}

	//vault code

}
Adding Infrastructure Observability
To get a handle on what happens when stack.Up() runs, I have implemented a custom io.Writer, which is
passed into the ProgressStream constructor.
The custom progress stream's Write method is called once for each line emitted, which allows us to start new spans
when a resource starts being constructed, and send them when construction completes. This is currently achieved by
parsing the console output text, but I gather in the future, it will be possible to get streamed JSON blobs that can
be unmarshaled into go structs.
type pulumiBeeline struct {
	ctx      context.Context
	contexts map[string]func()
}

func NewPulumiBeeline(ctx context.Context) *pulumiBeeline {
	return &pulumiBeeline{
		ctx:  	ctx,
		contexts: map[string]func(){},
	}
}

func (cw *pulumiBeeline) Write(p []byte) (n int, err error) {

	// todo: make more robust, support modifications, deletions etc.
	line := strings.TrimSpace(string(p))
	parts := strings.Split(line, " ")
	if len(parts) < 5 {
		return len(p), nil
	}

	//+  aws-vpc dev creating
	//+  <type> <name> <action>
	resourceType := parts[2]
	resourceName := parts[3]
	resourceAction := parts[4]

	if resourceAction == "creating" {
		c, s := beeline.StartSpan(cw.ctx, resourceName)
		beeline.AddField(c, "type", resourceType)
		// add other things here

		cw.contexts[resourceName] = s.Send
	}

	if resourceAction == "created" {
		cw.contexts[resourceName]()
	}

	return len(p), nil
}
Modifying the optup.ProgressStreams is the only change needed to the original application:
stream := optup.ProgressStreams(os.Stdout, NewPulumiBeeline(ctx))
if _, err := stack.Up(ctx, stream); err != nil {
	beeline.AddField(ctx, "err", err)
	os.Exit(1)
}
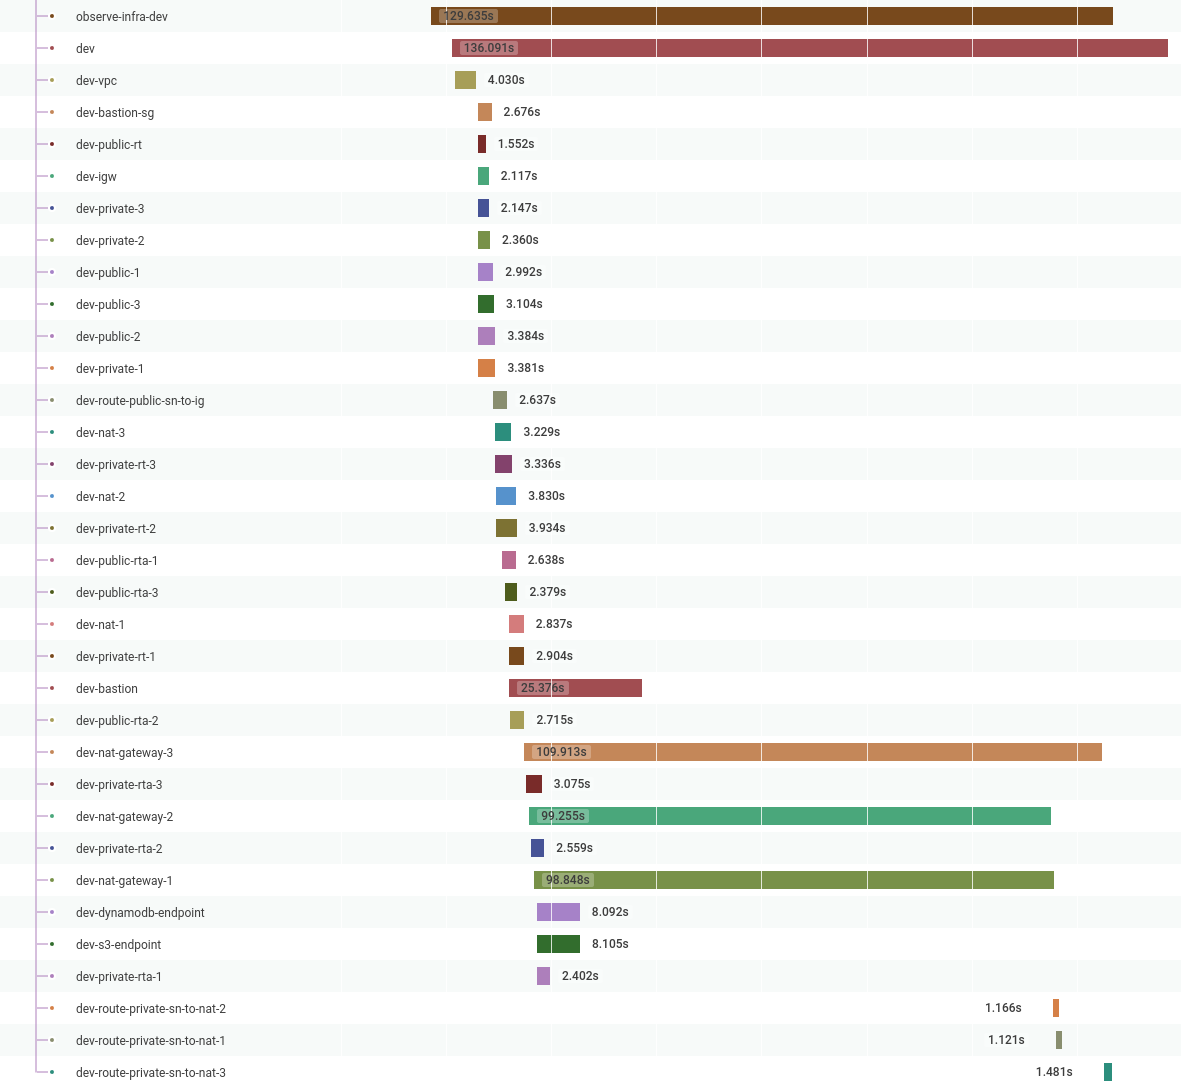
When I rerun this program, I can see a lot more information in my Honeycomb traces, which shows me that Pulumi is highly parallelized and provides a better idea of where the time is spent when creating infrastructure. In this example, it’s the NAT Gateways:
In the future, I want to expand this to cover far more details. Among those details are why resources were created/modified/destroyed and collecting more information on what causes resources to fail.
Wrapping Up
In the end, this turned out to be much easier to achieve than I had hoped. Using Pulumi programmatically was a huge
productivity boost, instead of running os.Exec directly.
I am looking forward to all the new kinds of tooling I can build to solve my user's problems by continuing to utilize Honeycomb for my observability and Pulumi for my infrastructure.